 Alex Dupler
Fabric Apps and Performance Optimization
Part 1: Query Reduction
- Fabric Apps
- Power BI
- Performance
The launch of Fabric Apps and presentations at FabCon Barcelona positioning them as “the next evolution of Power BI” has led to a lot of discussion (1, 2, 3, 4) about how Power BI reports and Fabric Apps compare and if Fabric Apps completely supersede the role of Power BI reports. I won’t try to answer those questions here (but for me, they totally do). Instead this series is going to focus on how performance tuning changes in the world of Fabric Apps.
On the surface, things might seem to be very similar: Fabric Apps can query the semantic model using a connector that wraps the Execute Queries REST API (connector docs, prerequisites) and that connector performs pretty much the same as the interface Power BI Reports use to query the model. However, as we peel back the onion we see that the defining feature of Fabric Apps, the ability to do literally anything (It can run Doom), because it’s just JavaScript, applies to performance as well. The much wider palette of design choices also gives us a much broader set of performance management levers. For good and for bad.
All the ways to tune your Apps (I can think of)
- Query Reduction: in a Power BI Report, there is a hard rule: one visual, one DAX query. But in Fabric Apps, we have complete control. A single query can feed all your visuals, or some of your visuals. You can even have multiple queries feed one visual.
- Custom DAX: All Power BI report queries are generated by the same query generation engine. It generates a generally performant query pattern, but you can explore other approaches. Especially when you are fetching data for multiple visuals, you have a lot of flexibility in DAX used to generate the data.
- Application Logic: Just like Power BI has added visual calculations, your app does not have to show exactly the data it fetches. You can calculate derived metrics in the App. This may or may not be a good idea.
- Choice of source: Fabric Apps don’t just query semantic models. In fact, it’s not even the default behavior. Fabric Apps today document support for connections to four data sources: SQL Databases, Warehouses & SQL Analytics Endpoints, Semantic Models. Each of these query engines are optimized for different query types and are billed differently.
- Interactions: One limitation of Fabric Apps relative to Power BI reports, is that there is no out of the box cross filtering, slicer, or other kind of query rewrite library or tooling. How you implement interactivity is entirely in your control.
- Caching, and prefetch: Because we control the entire query, as part of implementing interactions, one thing to consider, is that the app can fetch more data than it needs right now. This can result in nearly instant interactions. This can be done by simply expanding the shape of your queries, or you can silently fetch background data in follow queries for likely interaction paths.
- Browser computation: In Application logic we discussed how the app can do client side calculations. But it can do so much more than that. It can run advanced embedded query engines like DuckDB.
- Deployment-time precomputation and Caching: What if you didn’t run any queries at all? Or at least not until the user filters or interacts with the data. If your semantic model refreshes infrequently, and you don’t need role based data security, you can preload the initial data points into the deployed dashboard.
- Traditional Web App performance techniques: Before, you could only make your DAX slow. Now you can make slow JavaScript too! I don’t actually know anything about this yet, but we can find out together.
I’m going to make a separate post about each of these topics. Today we are going to focus on #1, Query Reduction.
How many queries does it take to light up a dashboard?
A typical BI dashboard often has multiple visual elements with the same or similar data. Cards with total revenue, and various KPIs based on revenue vs comparison points, a table with revenue over time by category. a line chart with revenue over time. All of these elements need to aggregate the same underlying data. But in a Power BI report, each element usually needs to be its own visual, and each visual issues its own Query.
The Analysis Services engine has long had a query planning feature called DAX fusion, which combines storage engine scans when two parts of a query need data from the same column. This can have a dramatic impact on the performance of queries. But fusion has never been able to consider multiple concurrent queries. And even within a single query, fusion can be fragile, disrupted by semantically minor differences.
Fabric Apps, however, break down the fixed relationship between visuals and queries. Queries are mapped to visual elements using code. Code that we have complete control over. The skills and templates scaffolded by Rayfin provide your agent with a standard way to do this, but of course, you can change that.
As a result, we can have any number of queries mapped to any number of visual elements. This gives us a very powerful tool for query optimization. We could try to fetch every single data point the dashboard needs in a single query. Or one per fact table. Or one per grain. The permutations are endless.
A simple example
I had my agent create some very basic reports for testing different optimization scenarios.
Have an Opus 5.5 session design a sample business performance report for each [Adventure Works and Space Parts] dataset. then have Sol 6.1 implement those sample reports as both a pbi report and a fabric app. Use another opus session to review the examples against each other. then we can work through exploring these [performance optimization] changes one by one using the fabric app.
That was the entire prompt. I didn’t give it any feedback or help other than a reminder to the design session to actually look at the space parts data before designing. What it came up with was good enough for our purposes.
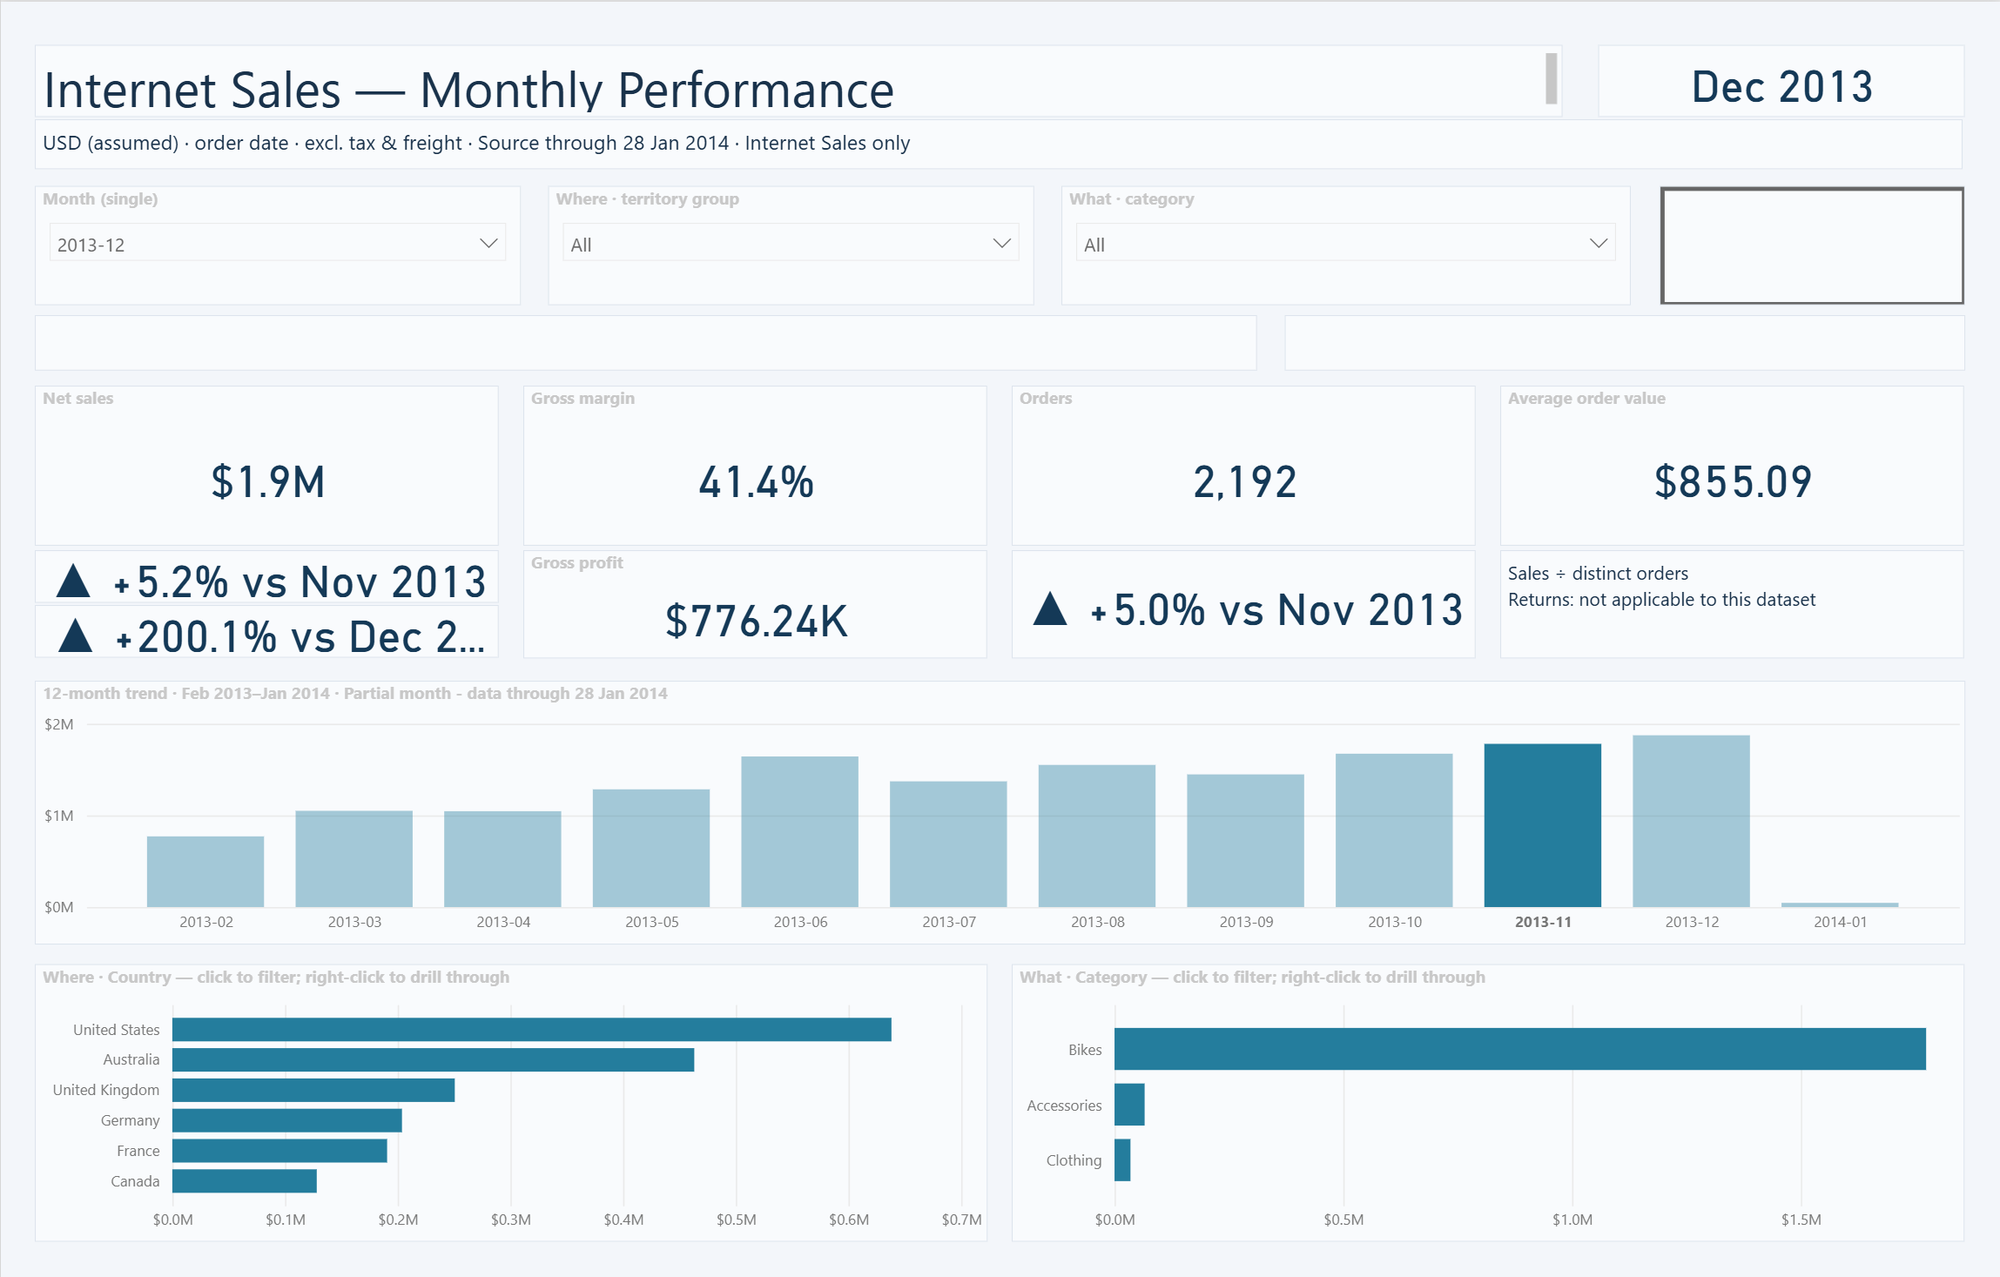
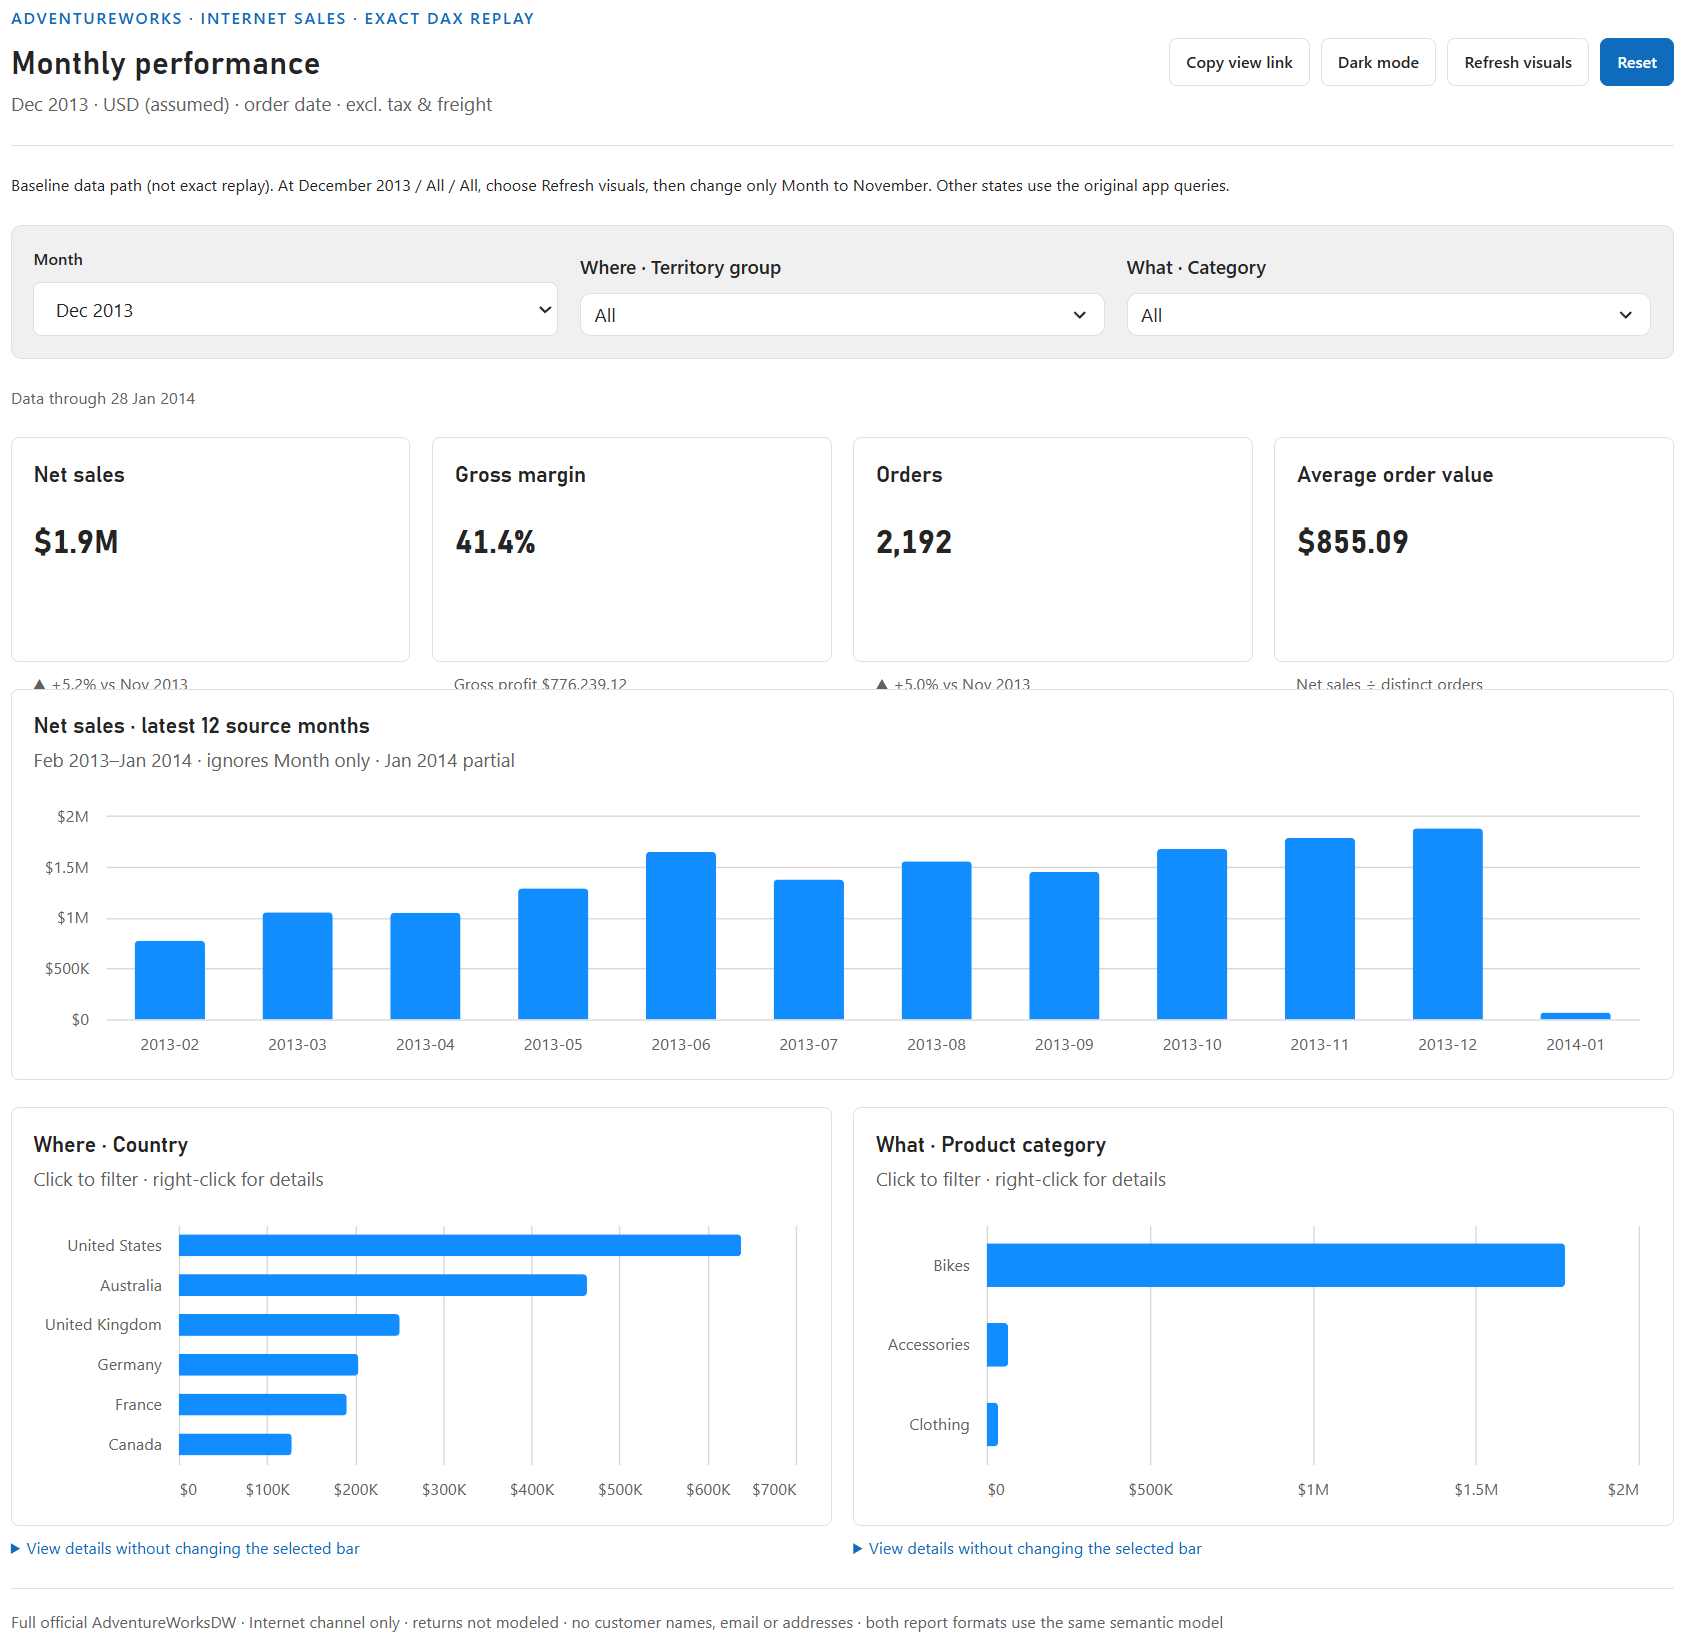
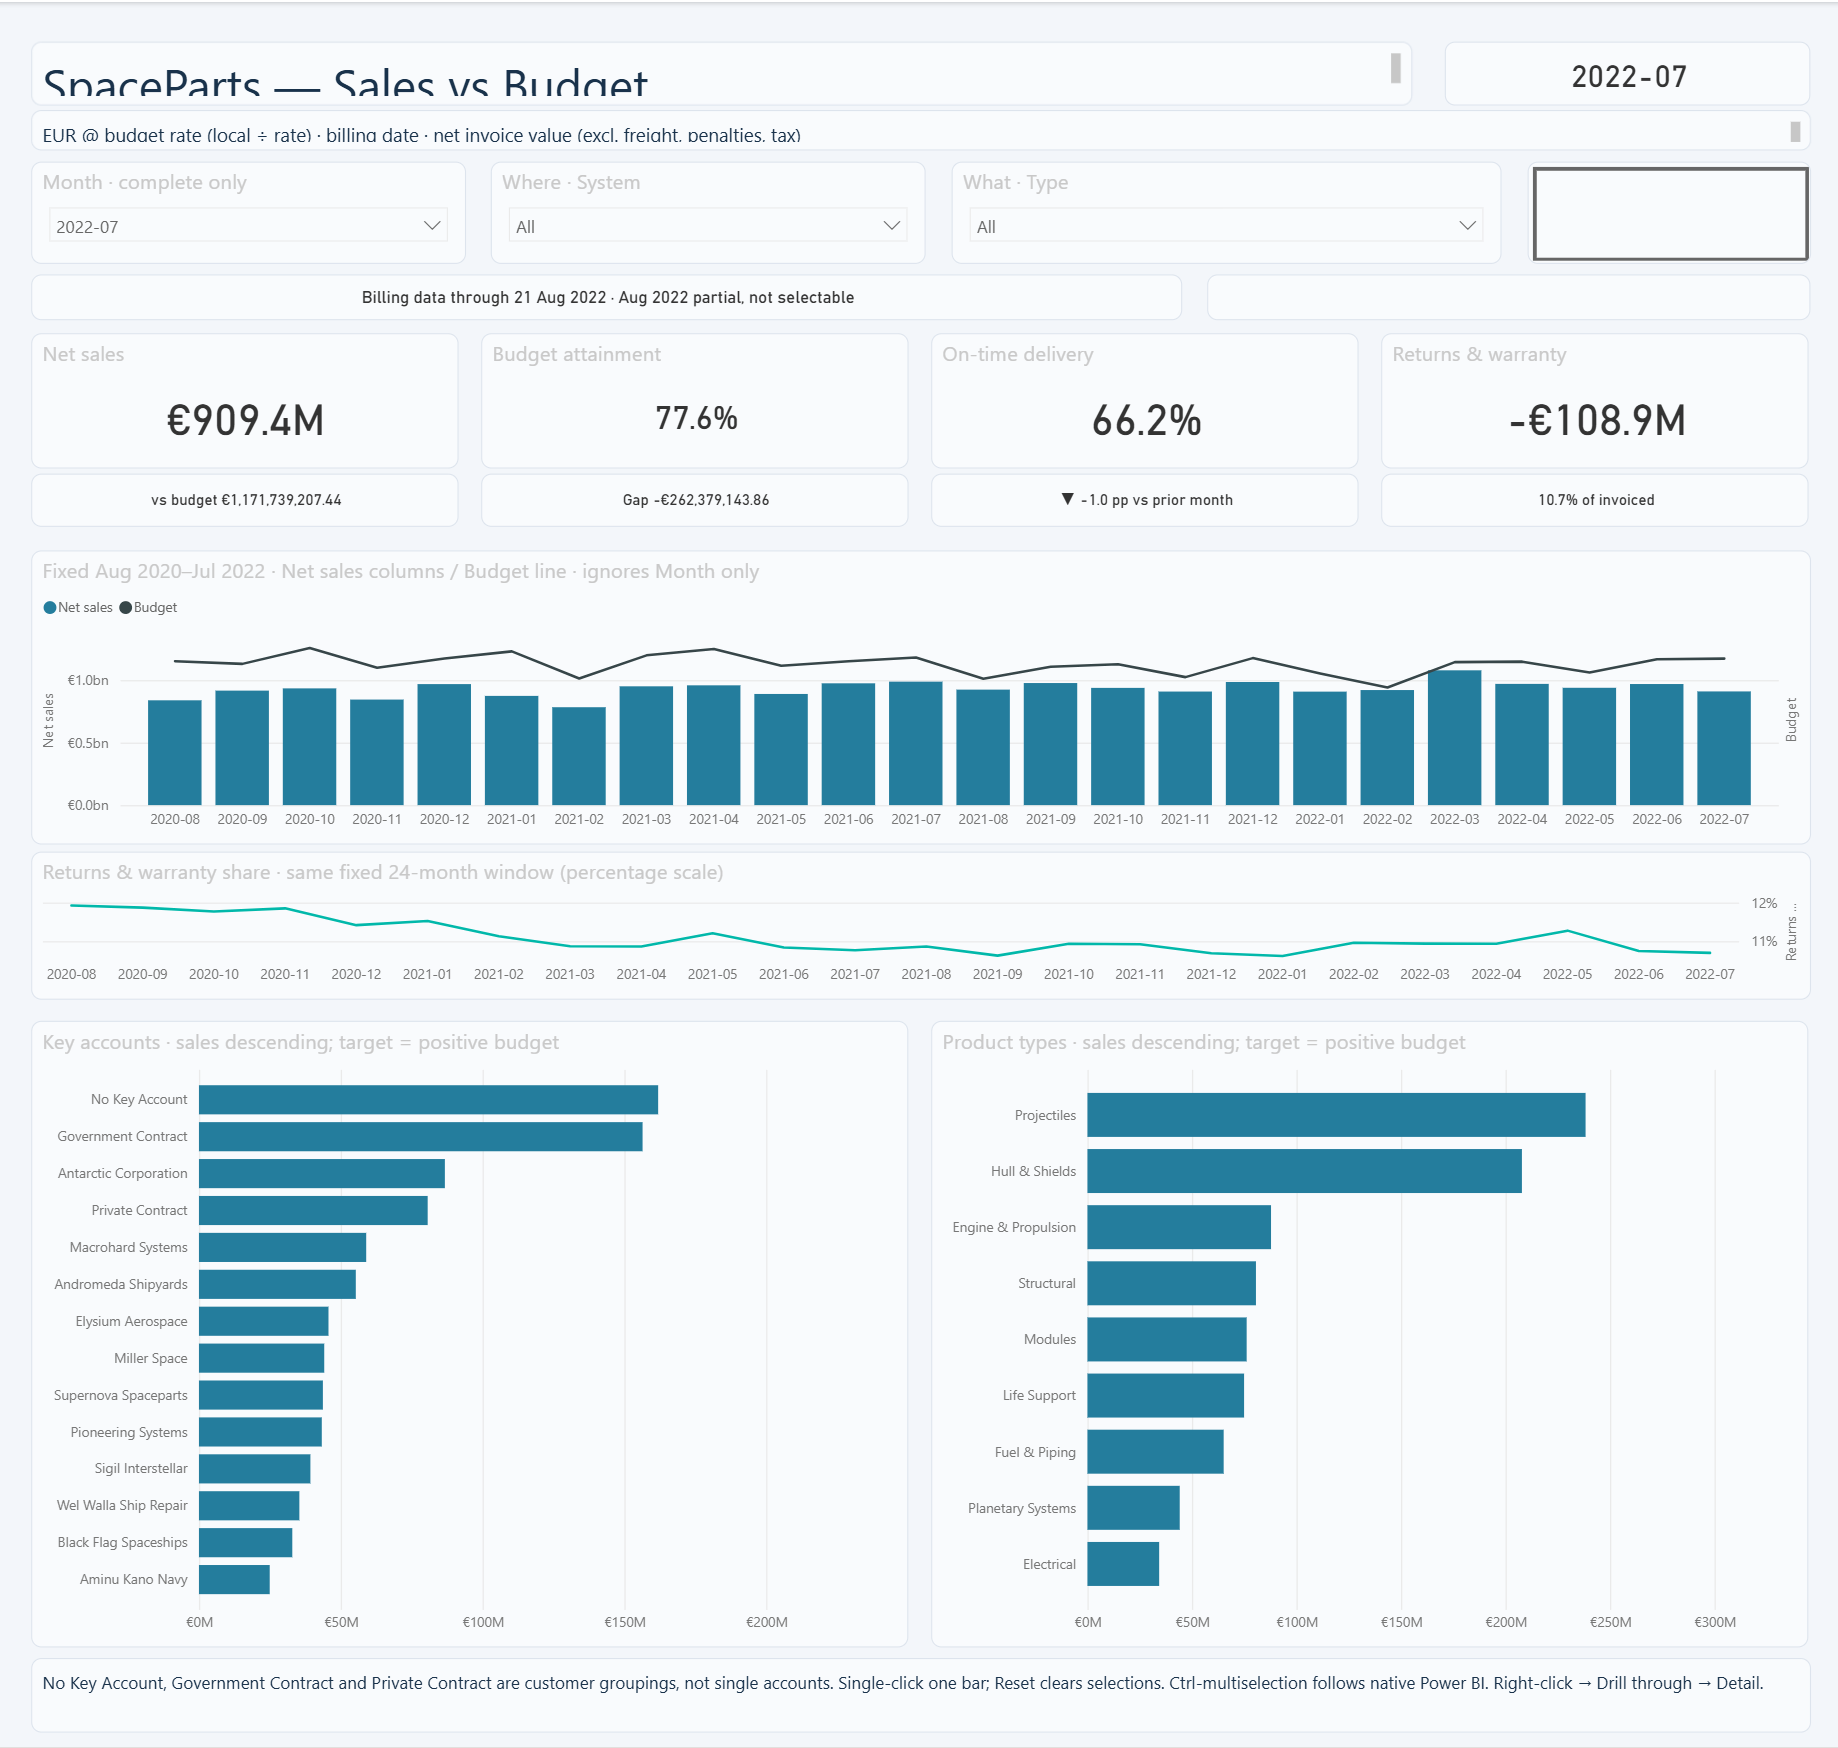
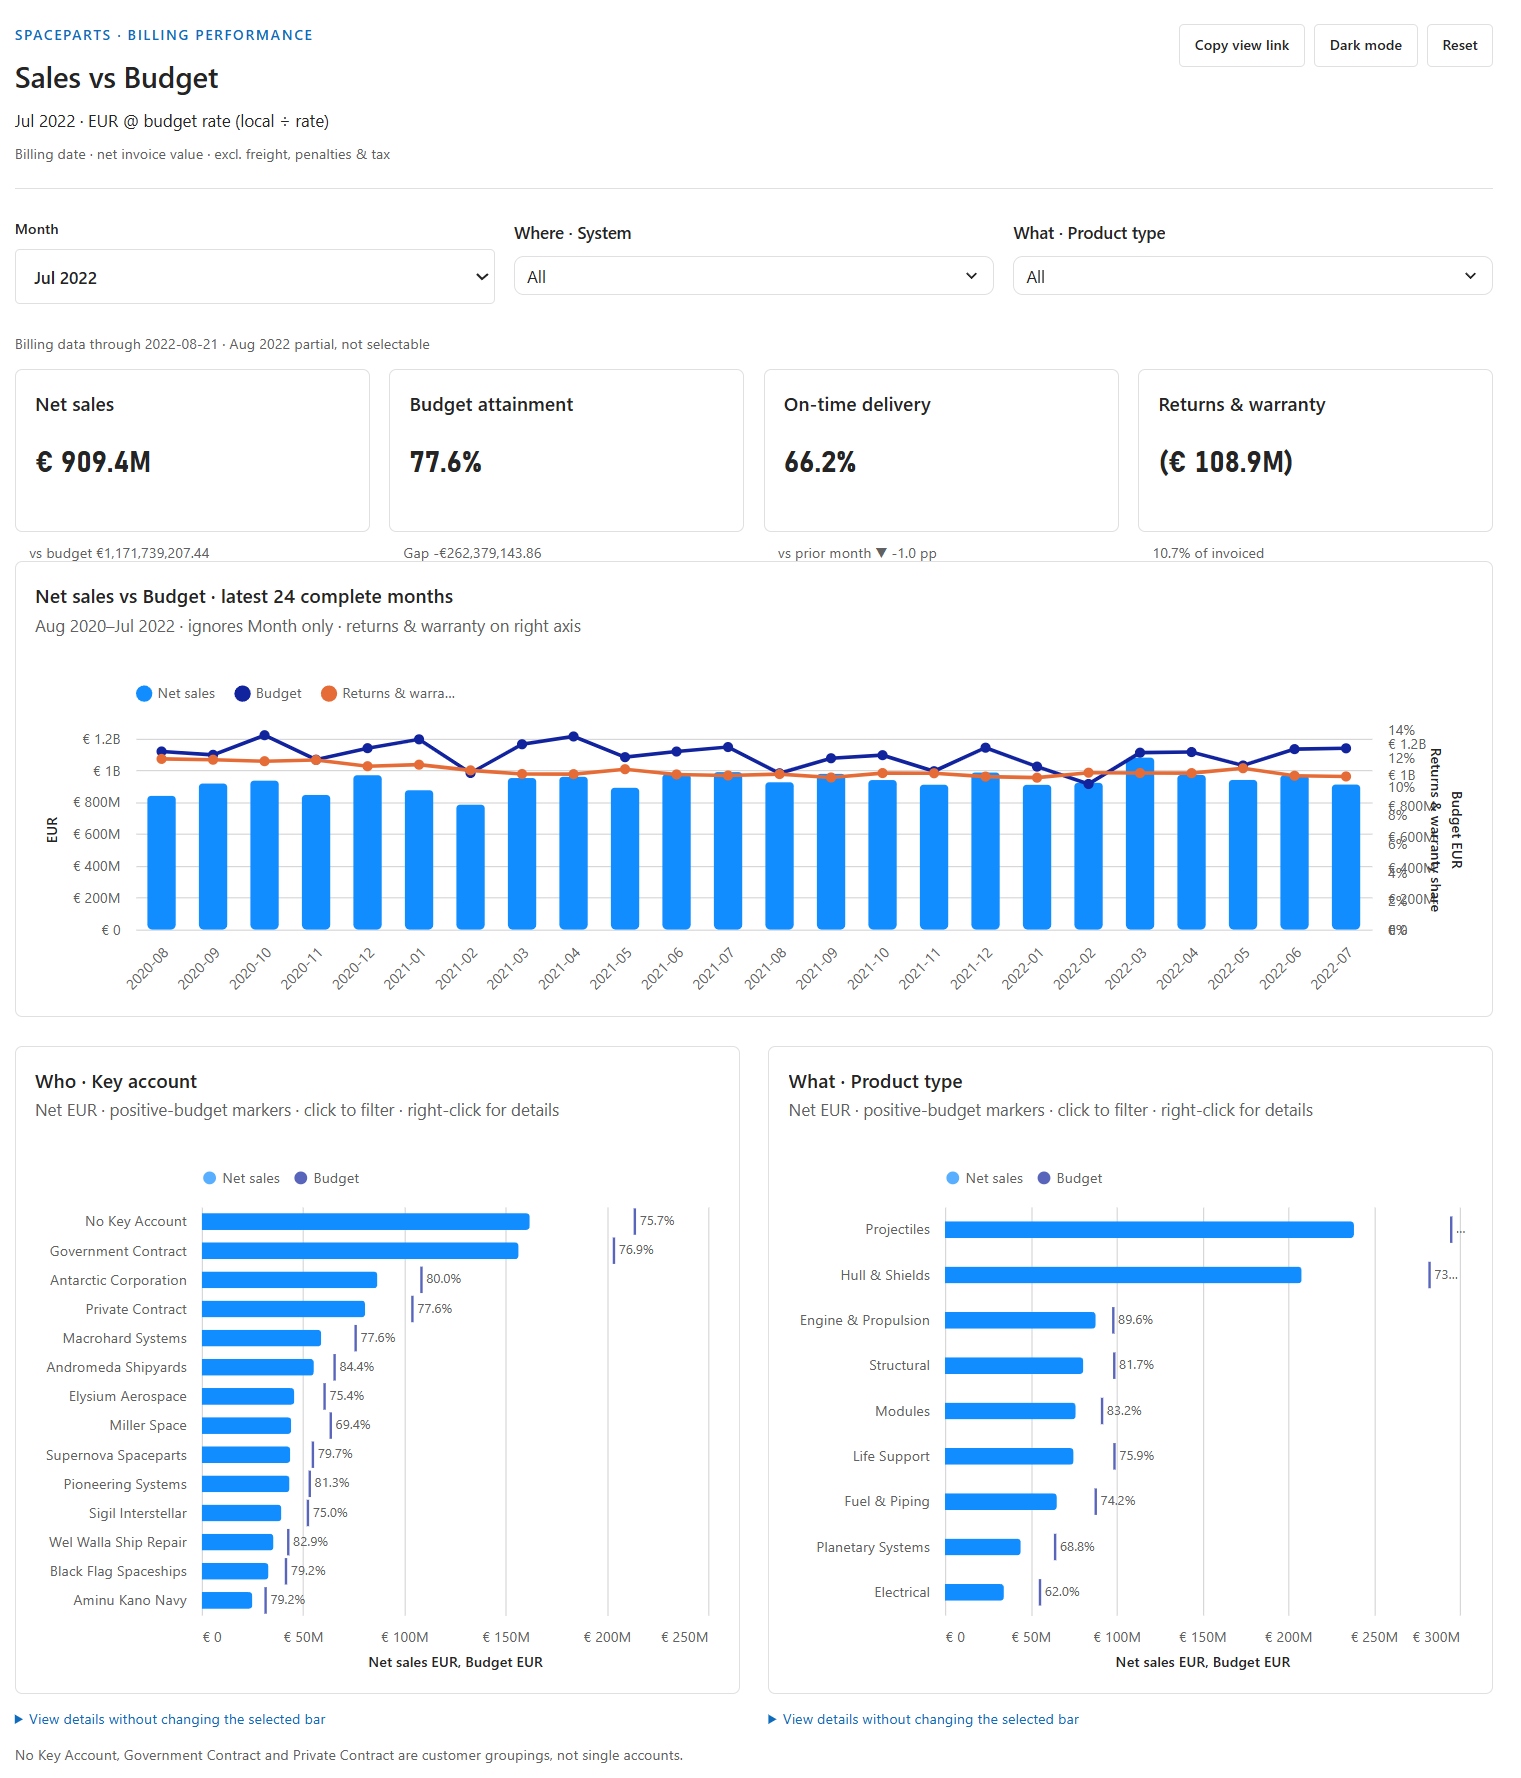
Previews are cropped to the top of each dashboard. Select a preview to open the full screenshot.
Sigh. You get what you ask for when it comes to prompting I guess. Anyway, for this blog we are going to focus on the Adventure Works dashboards. The Power BI Report has 14 visuals with data so it sends 14 queries. The Fabric App based on the above prompt was implemented to send just 4 queries. I then asked the agent to extract the exact query text from the 14 queries the Power BI report uses and implement those queries in the Fabric App. Finally, I asked a Sol 6.2 Medium agent to try to optimize that 14 query app the way Power BI would. This took a couple prompts. It turns out the original implementation session did a much better job at query design than visual design.
at the same time, have a fresh session take our 14 query 1:1 app and try to optimize the queries by combining visuals to share queries. have it try at least 10 variations. I also want to measure the LLM token cost and time of that optimization run.
Results are worse than the 3 query setup we originally got
Also the summary stats are very revealing. The 1 query is worse than the 3 query baseline on EVERY metric. and worse than the 13 query naive build on most metrics. so why did we pick that one. let’s give our optimization session a follow up prompt to optimize for final render time and work for another 10 rounds until it has something better than our one shot.
Still worse
let’s give our query optimizer a 30 minute budget to try as many queries as it wants and see if it can find an improvement. in all our query tests, have we been controlling for PBI models built in caching? repeated runs aren’t helpful if they just keep hitting the cache. then we are mostly testing the wire protocol, not the queries.
It finds a better 3 query setup, by rewriting the DAX.
that’s a great example for our future blog on customizing the DAX vs using machine generated dax. Less good of an example for this blog on query count optimization. maybe that same idea can be applied to a 2 or 4 query pattern for the purpose of this blog post.
All of this resulted in us trying 51 candidates. The session used 28.02 million tokens, or 1,134.72 GitHub Copilot AI Credits ($11.35 at list prices), and took 41 min 21 sec across the three run windows. I’ve pulled out the performance of 4 of these candidates to demonstrate the effect changing the query topology can have.
Results
These results are collected from the Workspace monitoring engine logs. When collecting this data we cleared the cache before sending each batch of queries, but not between each query as queries were submitted concurrently (and some SE events may hit cache from a co-submitted DAX query if the SE event matches).
As you can see, query reduction had a dramatic effect.
Trying to stuff everything into as few queries as possible won’t always be the optimal design. For example, we did try a 1 query design, but it used more engine CPU than the original 4 query setup our one shot prompt gave us (median summed Statement CPU of 453 ms vs. 265 ms, higher in all four paired runs; elapsed engine time split two apiece).
Conclusion
If you’ve spent any time working on Power BI, you’ve probably been told repeatedly that if you want to make your report faster, reduce the number of visuals. This is why Query Reduction is a very powerful tool for optimizing performance, even when you need to collect the exact same data points. Before Fabric Apps, query reduction always meant compromising on the design. But now, we can just tell our agent to try using a different number of queries.
What’s next
The queries in this article aren’t anything special. I didn’t look at or ask my agent to look at improving the quality of the DAX in the queries. I did use a decent model, Sol 6.2, but it’s hardly the best model available today. The optimization session didn’t even load any DAX or Power BI specific skills (during the session). It used the Rayfin CLI and DAX Studio CLI to run queries and clear the cache. That’s pretty much it.
Everything we know about tuning DAX can still be brought to bear. Which we will take a closer look at in the next post in this series: Fabric Apps and Custom DAX Queries.